MAY 2019 - Condo Market Update

Our team is now able to provide our clients with real-time, targeted micro-statistics of any real estate area (big or small) throughout the GTA. We can ZOOM IN and capture the sales data from one street and ZOOM OUT to capture an entire city's sales stats.
This can be of enormous use for any buyer or seller who wants to see more accurate LOCAL sales trends when researching an area or before putting in an offer to purchase. This is also a fantastic new tool for landlords to get updated rental prices! Please contact us today for this free service.
This month we are highlighting condo sales in the areas of Downtown Toronto, Markham, Yonge & Eglinton and Mississauga (stats based on 1-Bed, 1-Bath and 1-Parking as an example):
What does this mean for you? (scroll down to find out)
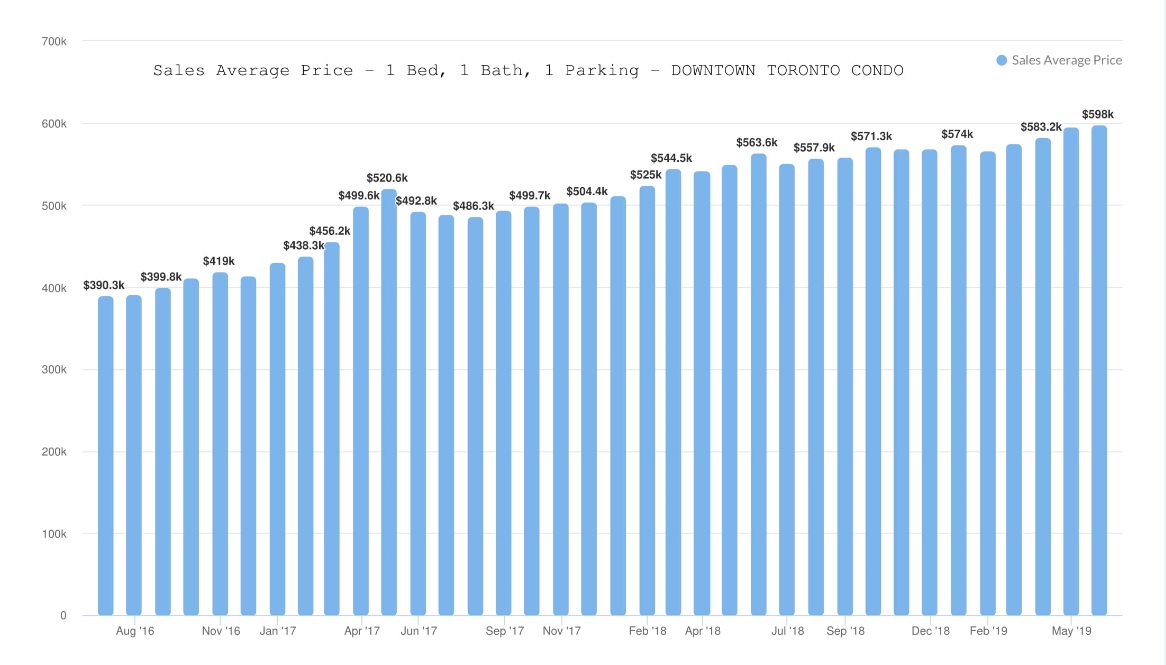
1) Downtown Toronto condo - Average sale price

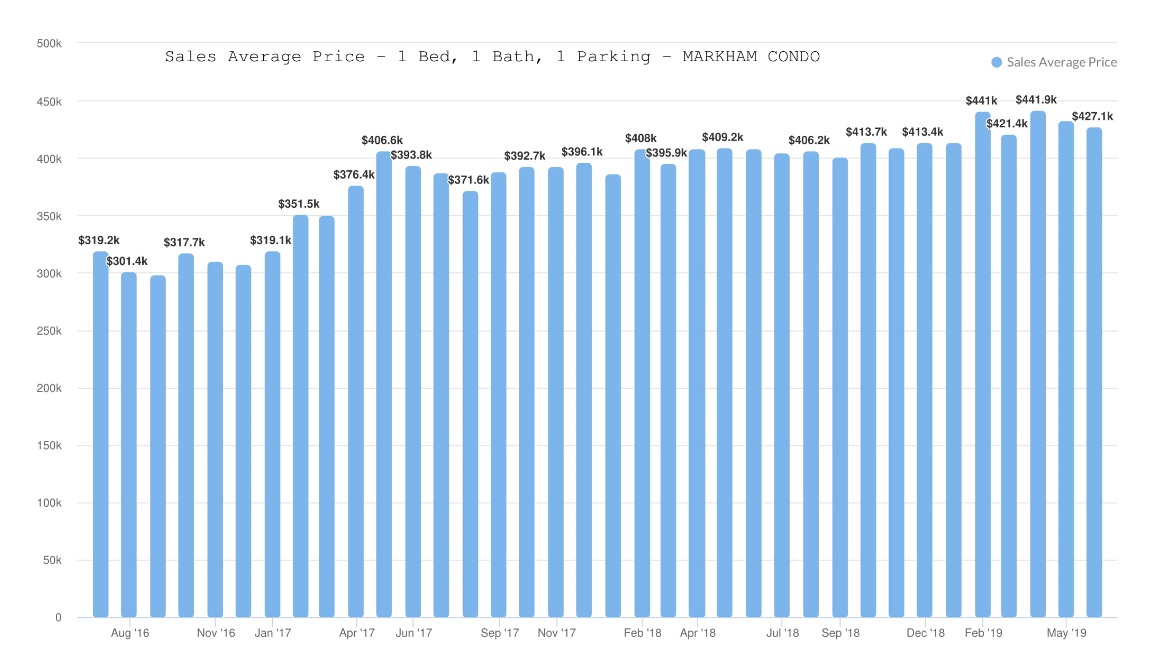
2) Markham condo - Average sale price

3) Yonge & Eglinton condo - Average sale price

4) Mississauga condo - Average sale price

What does this mean for you?
Generally speaking, a condo downtown Toronto still remains the most expensive out of these 4 areas, followed closely by Yonge & Eglinton. If you've driven (or tried to drive) around this intersection, there are more condos on the way. Plus there's the Eglinton LRT coming in the next several years. Lots of buyers go to Yonge & Eglinton to be close to downtown, but also not have to sacrifice too much on the square footage (or price per square foot) compared to downtown Toronto.
All condos in these areas have had tremendous appreciation over the past 3 years. They've also had appreciation over the past 6 months (although Yonge & Eglinton condos have been the most volatile). To learn more about the GTA condo market, please contact us today.
Is there another area that you are curious about? We can get the stats for you! Please contact us today for this free service.